Traders use technical analysis and the various tools that come with it to predict market trends and reversals. One such approach to studying price action in the market is using candlestick charts and their patterns.
Understanding the historical price of any asset is crucial in predicting trends and reversals. Usually, such data is displayed in the form of a bar chart, line chart, or candlestick chart.
Of these three, candlestick charts are the most popular as they give a complete picture of the high, low, open, and close prices of the asset in a given period. As such, traders rely on these charts to study patterns of reversals with a higher degree of accuracy.
But before we talk about candlestick patterns, let us first take a look at what are candlesticks and what they mean for traders.
What is a candlestick?
Each candlestick in a candlestick chart represents a certain period, as specified by the trader viewing the chart. If you choose D1, for example, then each candlestick will stand for price variations in a single day.
The candlestick method of tracking price movements was first conceptualized by a Japanese rice trader called Homma Munehisa who discovered that, apart from the rule of supply and demand, markets are also influenced by emotion.
Each candlestick has 3 main components:
- The body
- The wick (or shadow)
- The color
The candle body represents the opening and closing prices of an asset. The position of the open and close points depends on whether the candlestick is bullish or bearish. In a bullish candle stick (green) the close will be above the open price and in a bearish candlestick (red) the open will be above the close price.
The candle wick (also called shadow) is the line seen above and below the body of the candlestick. It is usual to see two wicks but not as a rule. Sometimes the wick might be visible on either end of the candlestick. The wicks represent the high and low prices for the given day/period.
The candle color represents the direction of price movement. A green body signifies a rise in price while a red body represents a fall in price.
What is a candlestick pattern?
A candlestick pattern is formed by several candlesticks that reflect movement in the asset’s price, graphically. Traders match the patterns seen on these charts to previous patterns and what they meant for the market. Over time, traders noticed that the price moved similarly when some of these patterns were observed in the charts. They then isolated and organized these patterns into different categories based on what they signified.
Let us now looks at the 10 most popular candlestick patterns used in crypto. First, we will look at some of the bullish patterns that are seen following a downtrend and signify a reversal. This is the time traders open long positions as they expect the asset price to go up further.
-
Hammer Pattern
The hammer candlestick is seen with a short body with a long lower wick. As a rule, it is usually found at the bottom of a downtrend. The candlestick signifies that the bulls resisted the selling pressure in the market and pushed the price back up thus marking a higher closing price.
-
Inverse Hammer Pattern
As the name describes, the inverse hammer is similar to the hammer pattern but is just the opposite. In this case, the body has a long upper wick and a short lower wick. This signifies that the asset survived a buying pressure and the price was not dragged down. Usually, in this case, the buyers come back even stronger and the price of the asset continues to climb higher signifying a bull run.
-
Piercing line
The piercing line is a 2-stick pattern that shows at the bottom of a downtrend, during a pullback, or at the support level. This pattern is marked by a long red candle followed by a long green candle. In this pattern, there is a marked gap between the green candle’s open price and the red candle’s close price. The green candle’s high opening price points to buying pressure in the market.
-
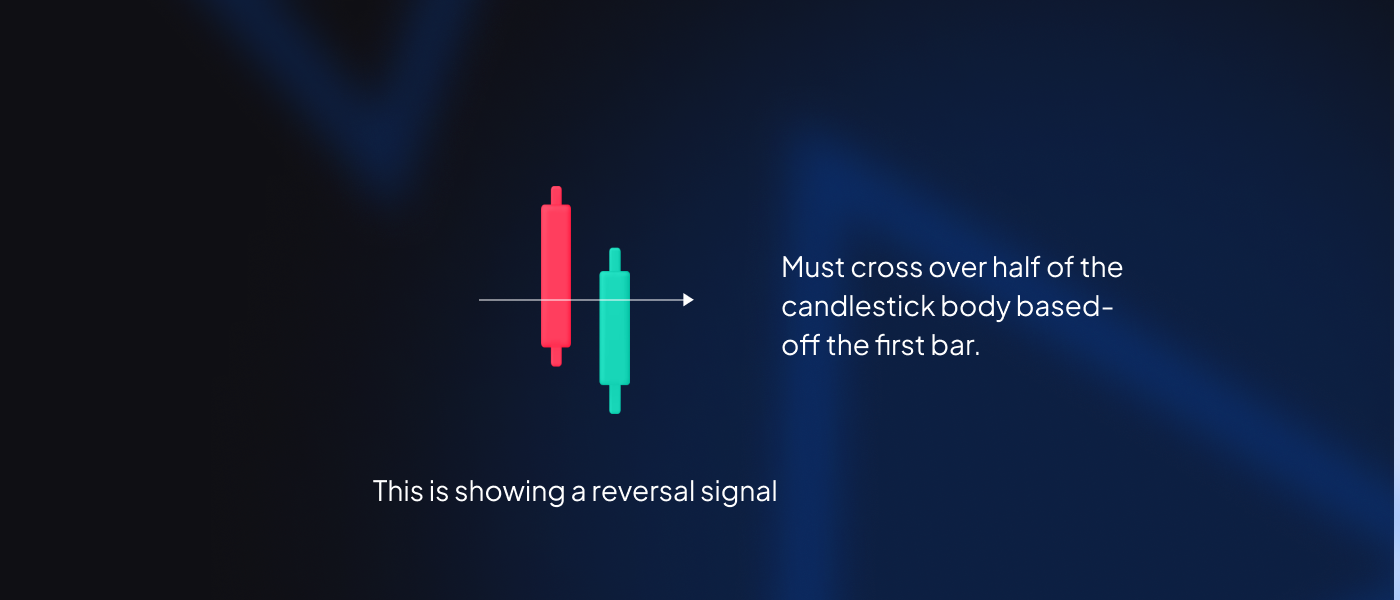
Bullish engulfing
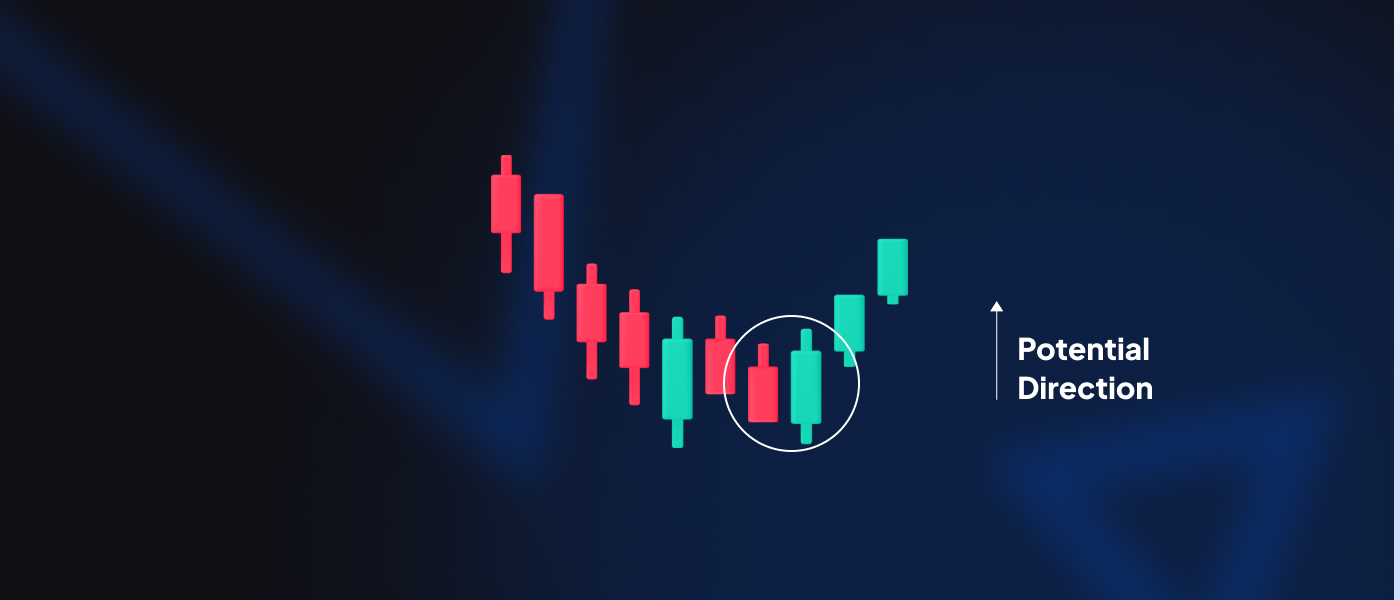
Bullish engulfing is once again a 2-candlestick pattern in which a short red candle is engulfed by a long green candle, thereby giving the pattern its name. Although the green candle opens lower than the red candle, it closes significantly higher given the rise in buying pressure and the reversal in the downtrend.
-
Three white soldiers
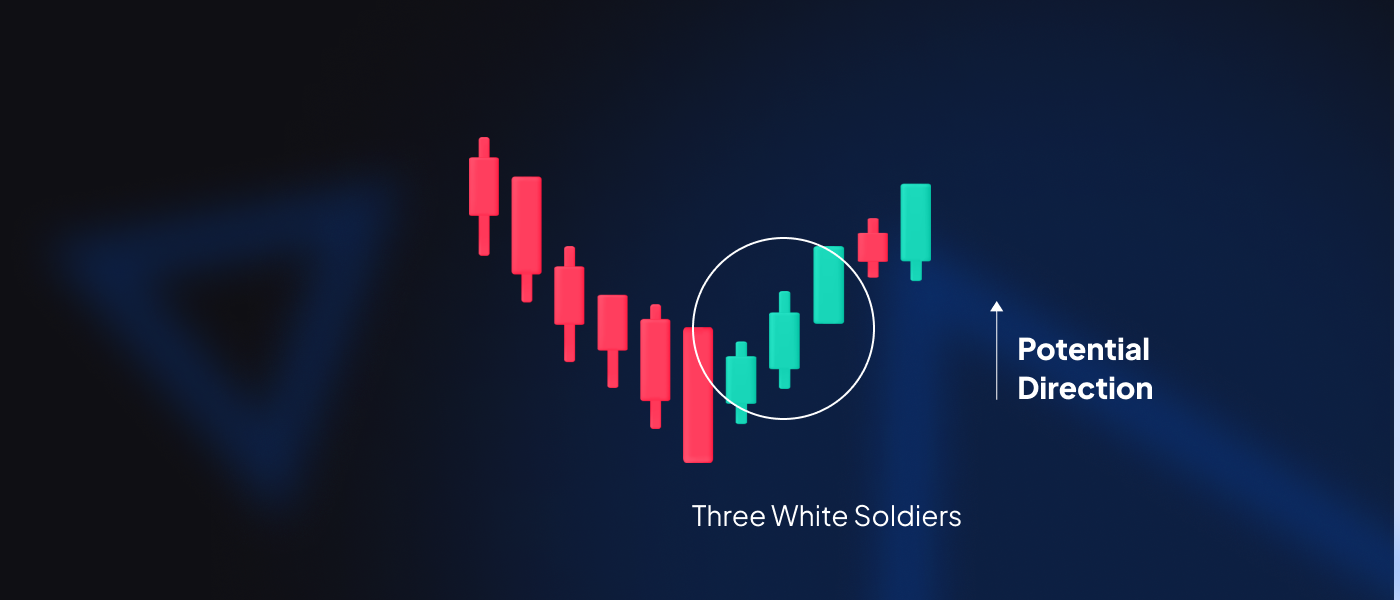
This is a 3-stick pattern that’s made up of three green candles in a row. The green candles are long with very small wicks on either end (and sometimes none at all). In this case, the open and close prices are higher than in previous periods. The three white soldiers is a strong bullish signal that can be spotted usually after a downtrend.
-
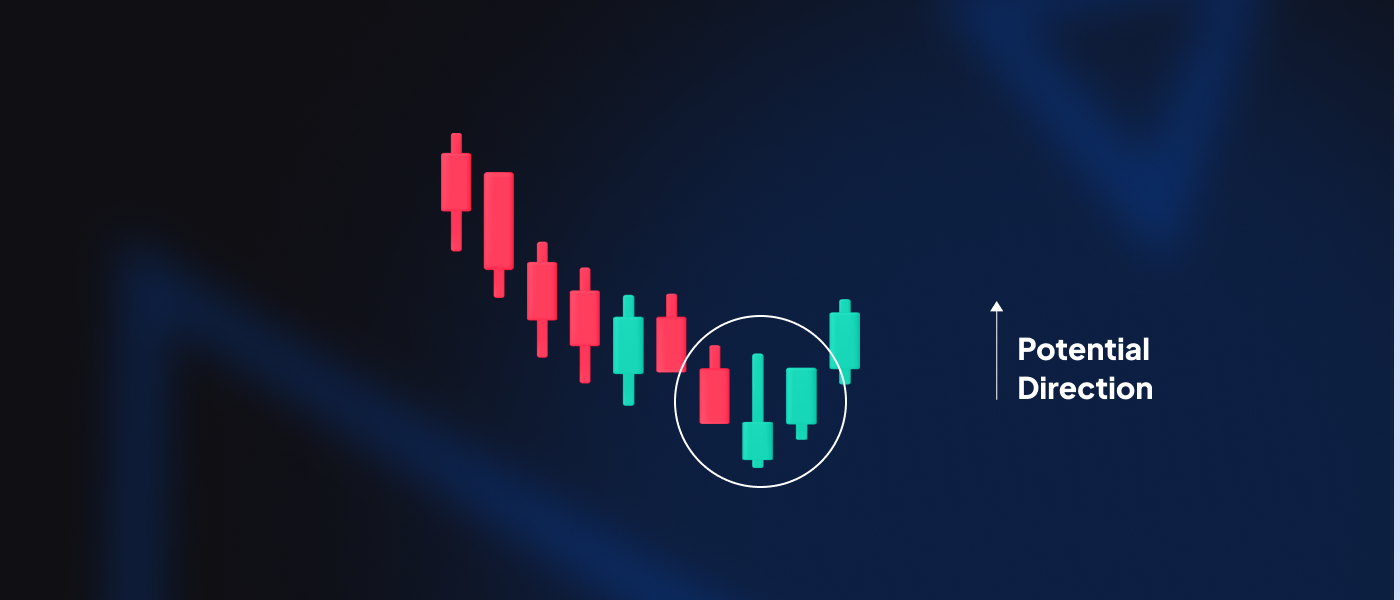
Morning star
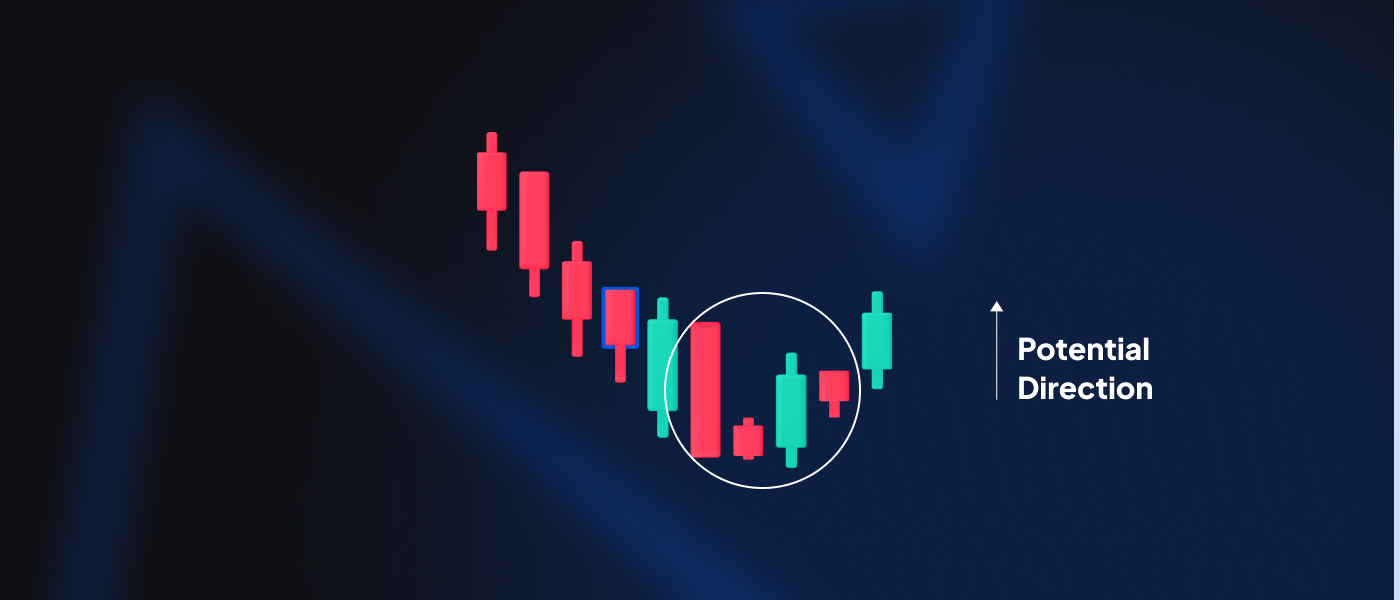
The morning star is once again a 3 candlestick pattern which comprises a long red candle, followed by a short candle and a long green candle. Normally, the short candle in between does not overlap the other two. This pattern signifies that the previous selling pressure is fading and slowly an uptrend is taking shape.
Let us now take a look at some of the bearish patterns that are seen after an uptrend, signifying a fall in prices and urging traders to open short positions.
-
Bearish engulfing
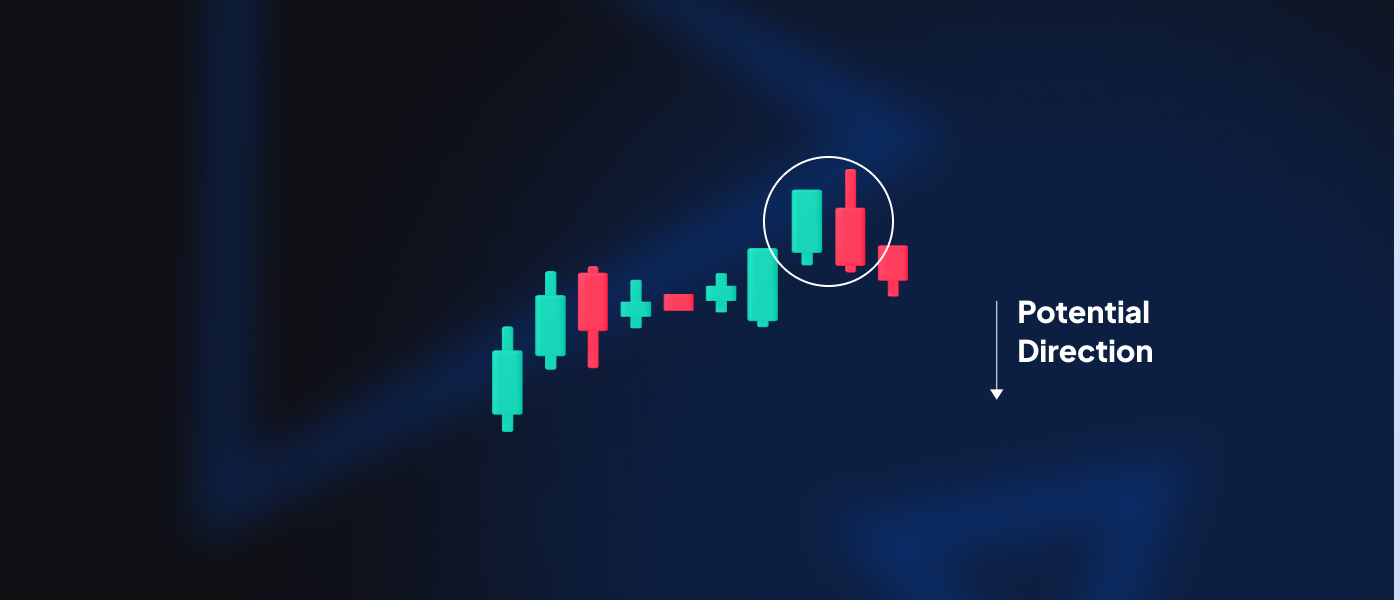
The bearish engulfing is the reverse of the bullish engulfing. The small green candle is engulfed by the longer red candle and usually appears at the height of an uptrend, suggesting a reversal in market trends. The lower the subsequent red candles continue, the stronger will be the momentum of the bear market.
-
Evening star
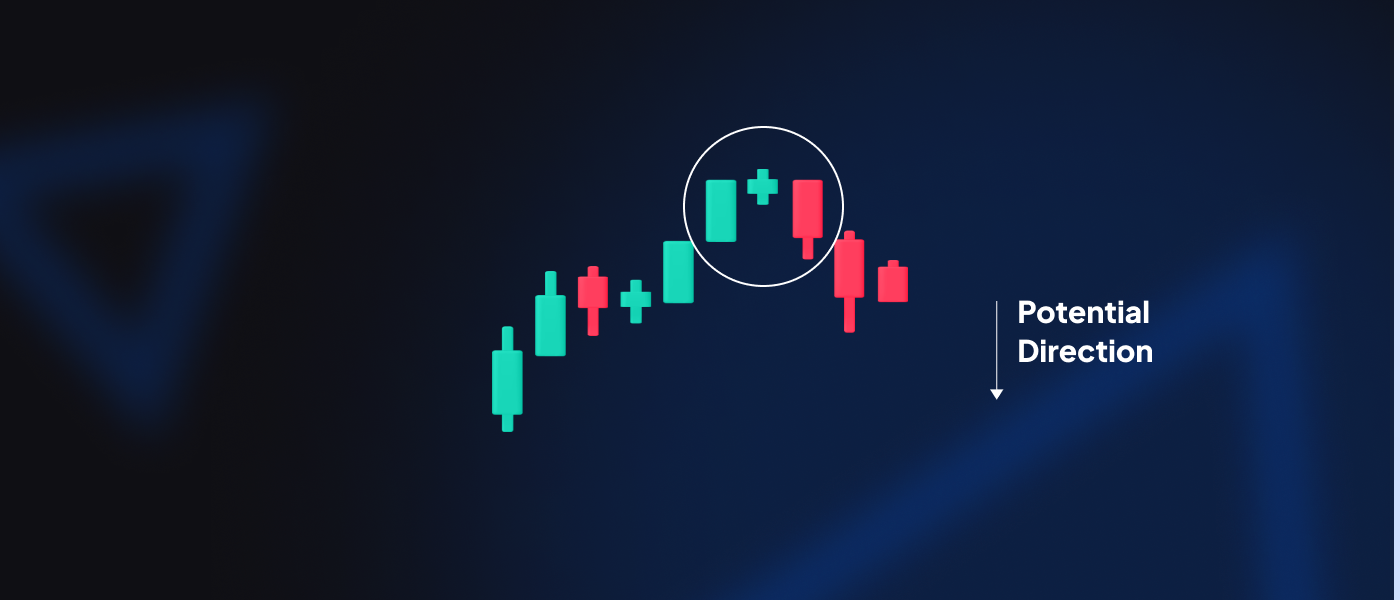
The evening star is the opposite of the morning star showcasing bullish trends. In this 3-stick pattern, there is a short-bodied green candle that lies in between a long green candle and a longer red candle. It signifies the potential downward movement of the market following the pattern.
-
Hanging man

The hanging man is an interesting pattern which is the hammer reversed. It comprises a short-bodied candle (red or green) with a long lower wick. It usually shows up around the end of an uptrend, showing that there was substantial selling pressure during the period when the bulls tried to push the prices higher but lost control later.
-
Three Black Crows
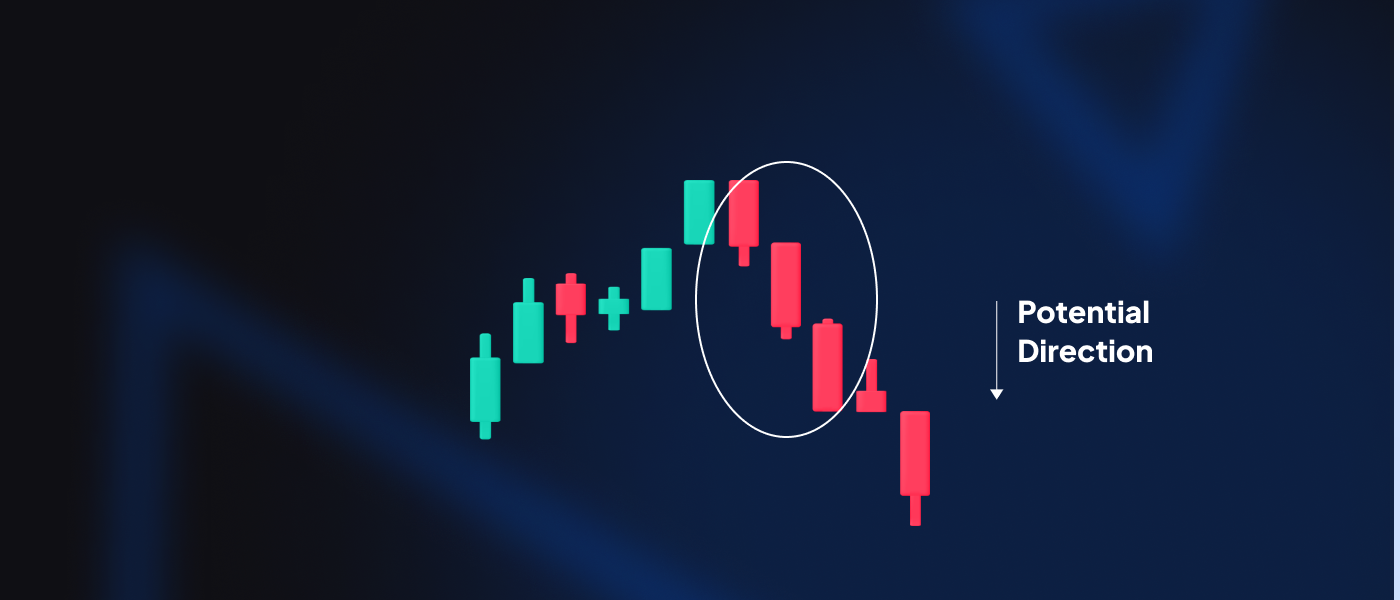
The three black crows are the inverse of the bullish three white soldiers. It comprises three long reds with little to no wicks. Each candle opens to the close of the previous candle and signifies a strong bearish signal with the prices going lower with every subsequent candle.
While the above-discussed ten candlestick patterns talked about Bullish and Bearish trends and reversals, some patterns hint at neutral market movements or a continuation in the current market trends, whether it is bullish or bearish. Popular among them are the Doji and the Spinning Top patterns.

Doji

Spinning top
Conclusion
Candlestick patterns could tell an entire story to a trader who knows to read them well. While they are immensely helpful, it does take some practice to read and use candlestick charts. Novice traders can also start using candlestick charts by viewing the general trend over some time. The more they peruse the charts the better a trader gets at reading them and identifying patterns.
When it comes to crypto, candlestick patterns can be especially useful as they give some idea to traders as to what to expect in a volatile market. Whether they should open long positions or what kind of potential moves they can expect in the market next. Swing traders use candlestick charts and patterns a lot to spot indicators that help them determine the continuation or reversal of the market trend.
Seasoned crypto traders use candlestick patterns to invest in various crypto assets to maximize their profit potential. If you are a novice in crypto trading, it would be good if you could start familiarizing yourself with candlestick patterns and how to read trends. You can start trading or investing small funds and learn in the process as you grow as a trader.
You could also use Eterna’s Copy Trading feature which lets you use the exact trading decisions and practices seasoned traders use in the market, thereby gaining from their knowledge and experience even if you are new to trading.
Sign up on Eterna to start your crypto trading journey, today.